Corrosion trends
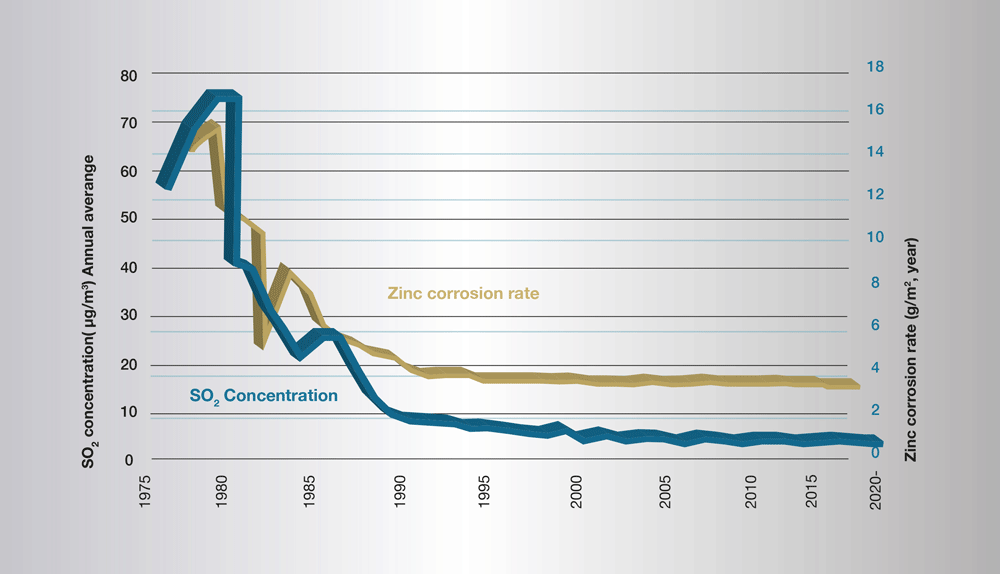
In recent years, corrosion has decreased significantly in both the Nordic countries and across the rest of Europe. Several factors have contributed to this decrease, but the main cause is a decrease in sulphur dioxide levels in the atmosphere. The combustion of fossil fuels has decreased and those that are still in use have a lower sulphur content than previously. Fig. 1-1 shows the trend in zinc corrosion in Stockholm associated with the decrease in sulphur dioxide levels.
Choice of corrosion prevention method
When choosing a corrosion prevention method for a steel component or structure, there are many technical factors to be analyzed and tested. The environment in which the steel component or structure is to work must be studied carefully. Stress during transportation, storage, fitting or erection should also be investigated, especially if the structure is to be exported outside of Europe. Further, an economic study of different prevention methods should be undertaken.
It is important that the choice of method be based not only on initial costs, but also on packing costs for transportation, touch-up painting after erection and future maintenance costs. The initial costs alone make up only part of the overall figure. Total costs over the entire service life of the structure can show something quite different.
Total life cycle costs include, in addition to the initial cost, costs for packing, transportation, repair after transport, installation, maintenance and environmental costs. For a design life requirement of 30 years for a construction, a paint system may require repairs or maintenance on two or three occasions and this will be much more expensive than the initial cost. This can be compared to use of a more durable corrosion protection system where no maintenance is needed. When the life time cost is used as a basis for calculations, a very different total cost is shown compared to when only initial application costs are used.